Platform · 3D Yard Map

3D Yard Map

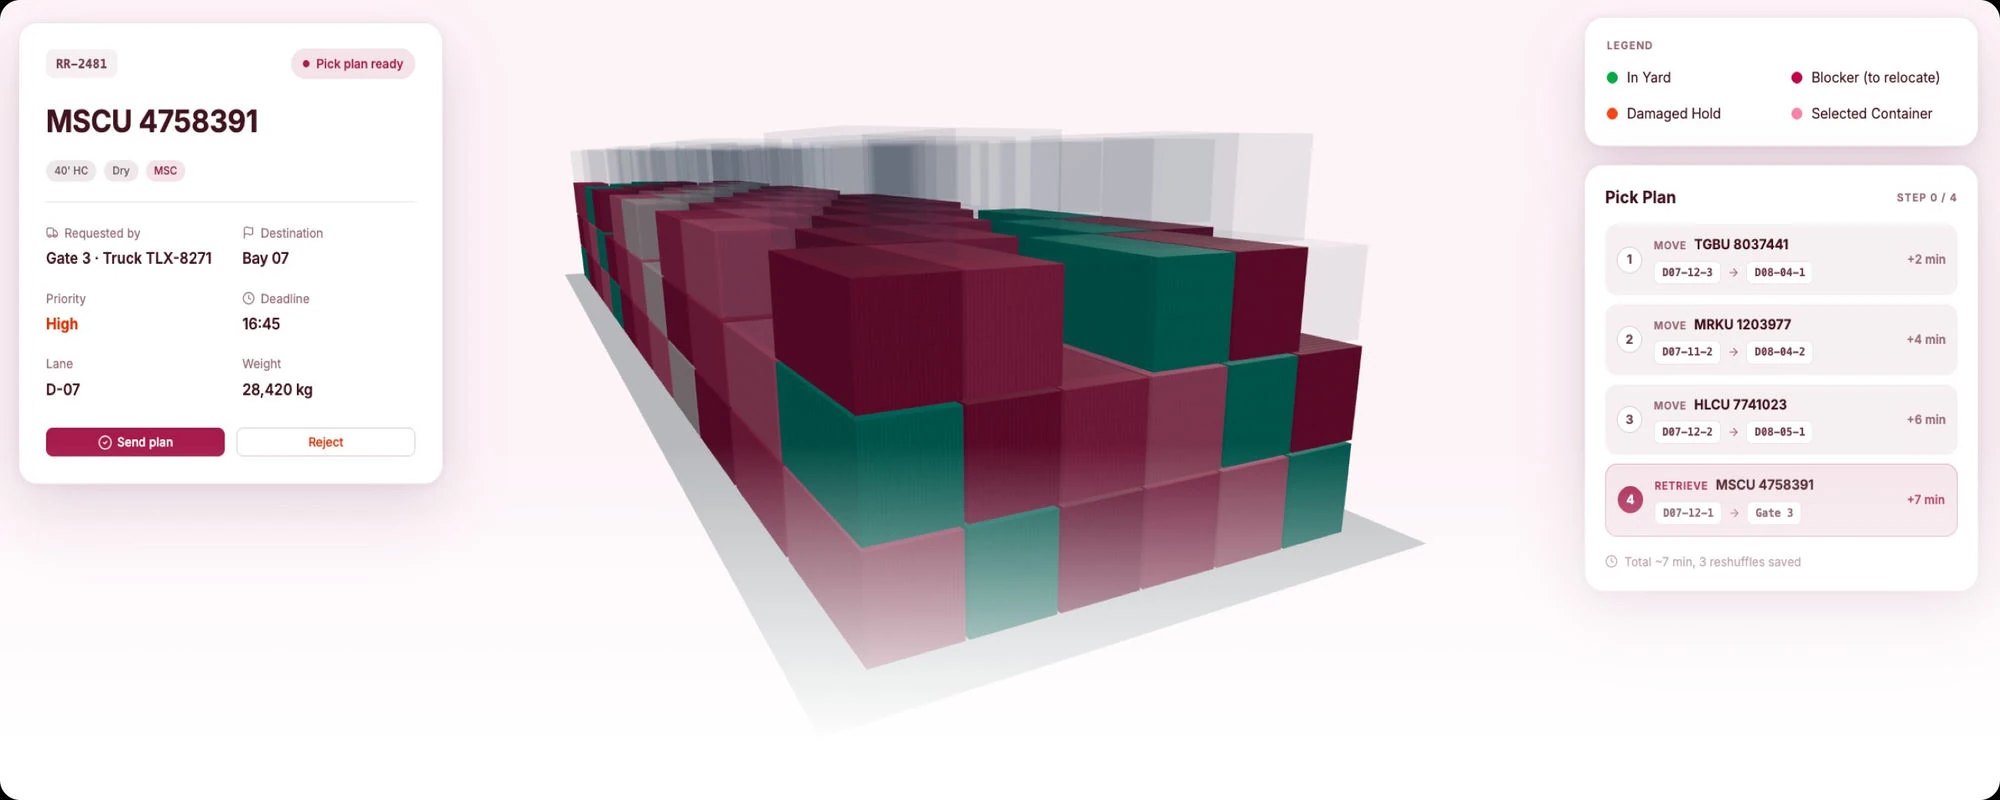
Every container in 3D, no special hardware. Tap one to dispatch, repair, or inspect.
3D MAP

Every container, every detail, in one view

Every container shows up in its slot at the correct stack tier. You see size, type, line, status, and dwell without opening anything. Density per block and equipment positions are on the same screen.
See yard management
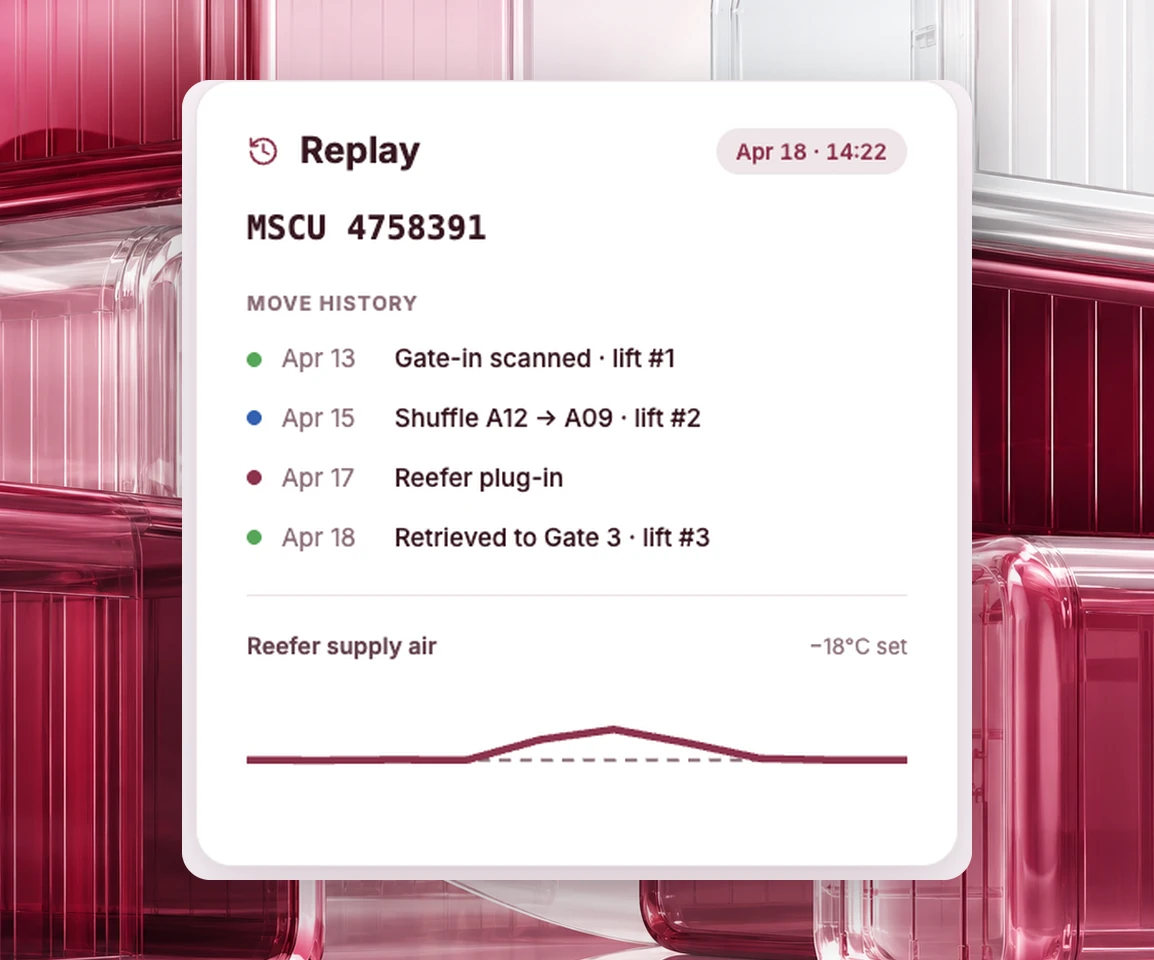
Click a container for its full history and lift count
Click a stack to plan the next move, a block to rebalance
Updates in seconds as RTGs and reach stackers finish each move
TEUX TOS 3d yard map
metrics

What the 3D map changes

−45%
Special hardware required
−50%
Lift operations counted
+35%
Surface, paved or unpaved
In short

A workspace, not a viewer

What the 3D map gives you
Live 3D view
Every container in its slot, not last night's snapshot
No site prep
Mobile, tablet, desktop. No concrete or special hardware.
Lift ops counted
Every lift logged and pushed into customer billing
Click to act
Dispatch, open a repair act, or inspect from one screen
One view
Density, equipment positions, and stack height together
Custom strategies
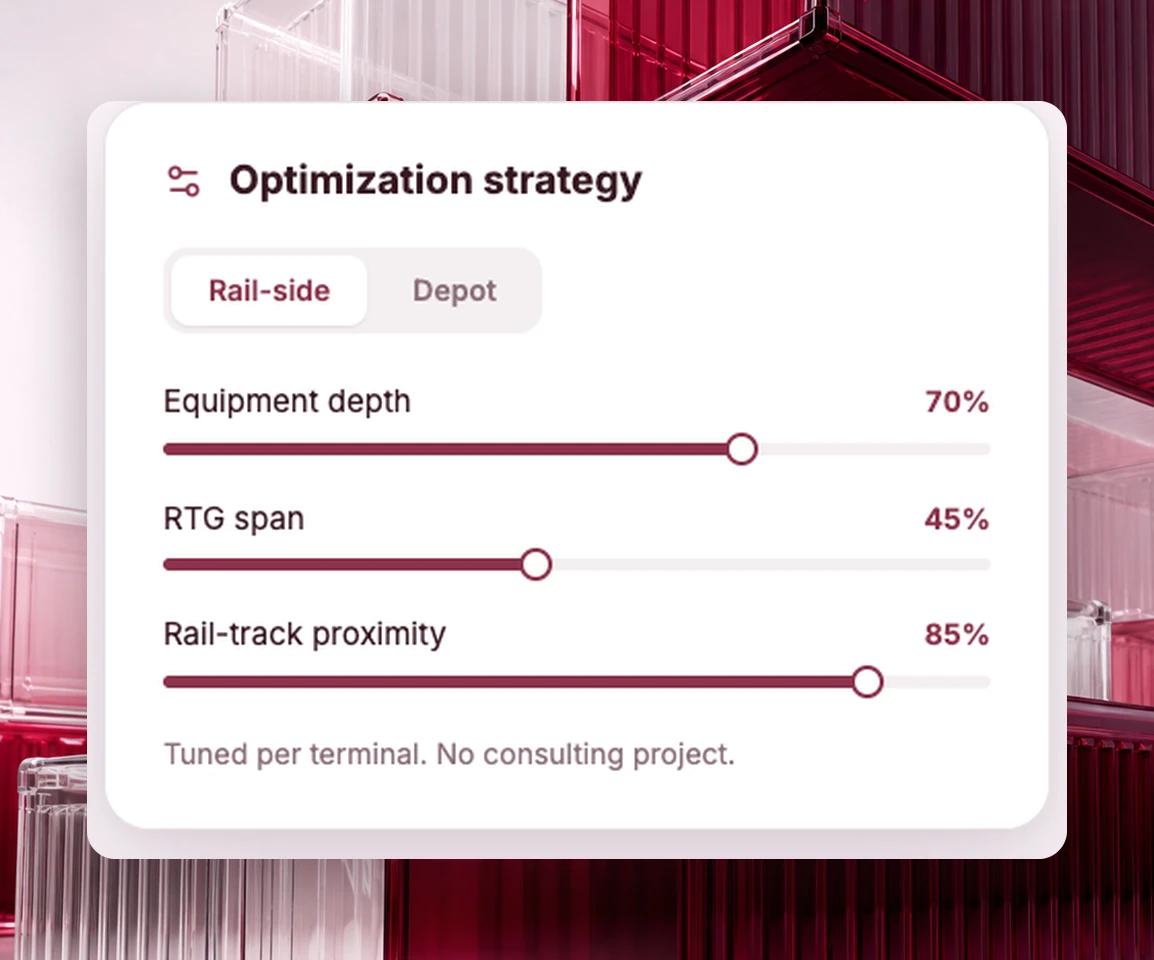
Tune optimization per equipment depth and rail-track proximity
Replay anything
Replay any container, any move, any moment in the timeline
See the 3D yard map running on your data
Get Started
DISPATCH

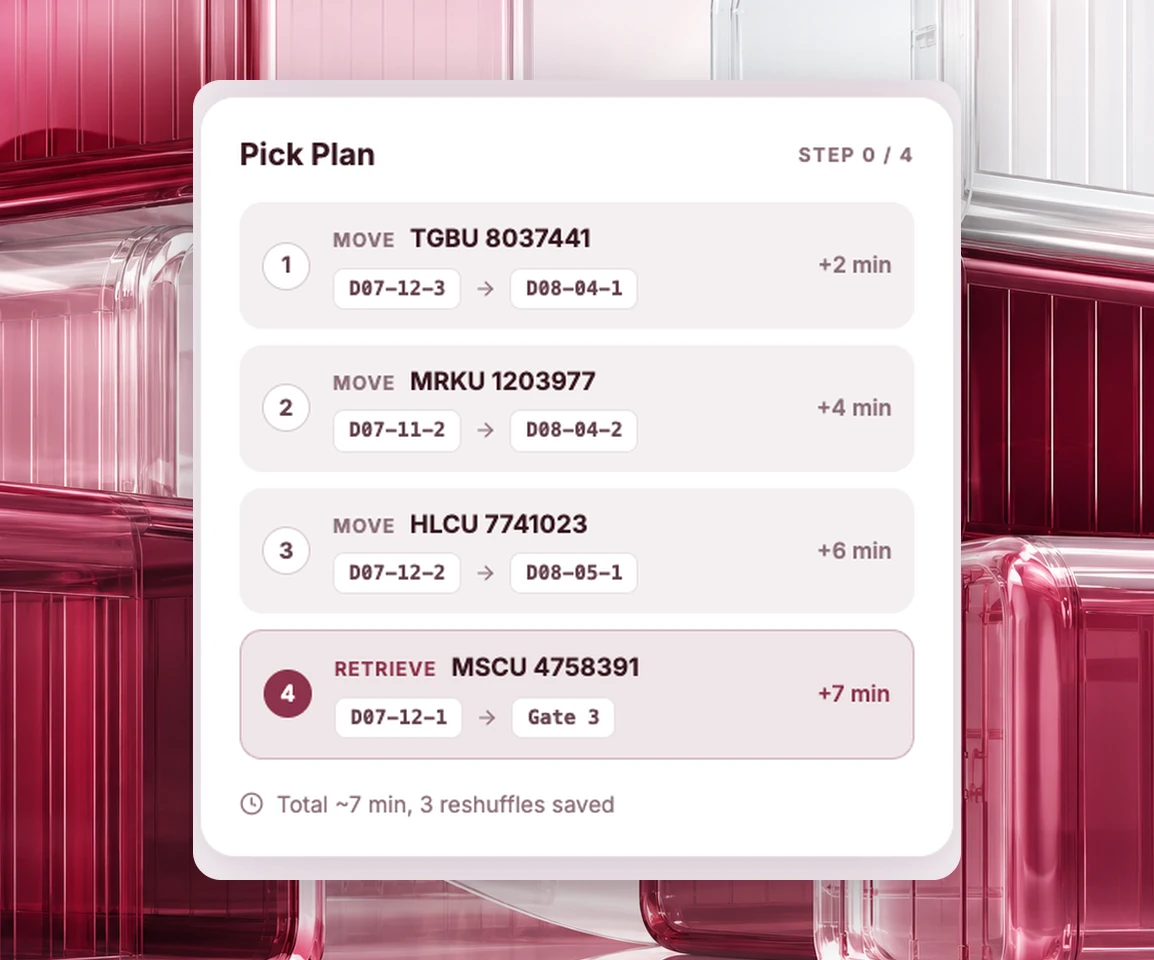
Retrievals with the fewest lifts

The map shows which container is leaving, where it sits, and the equipment-and-lift cost to retrieve it. Teux picks the box with the smallest dig. Your operator does fewer moves, your customer pays less, your equipment lasts longer.
Learn more
Pre-advice matched to a slot, ranked by retrieval cost
Lift count per retrieval, visible before the operator starts
Cheapest retrieval across container, slot, equipment, and time

INSPECTION

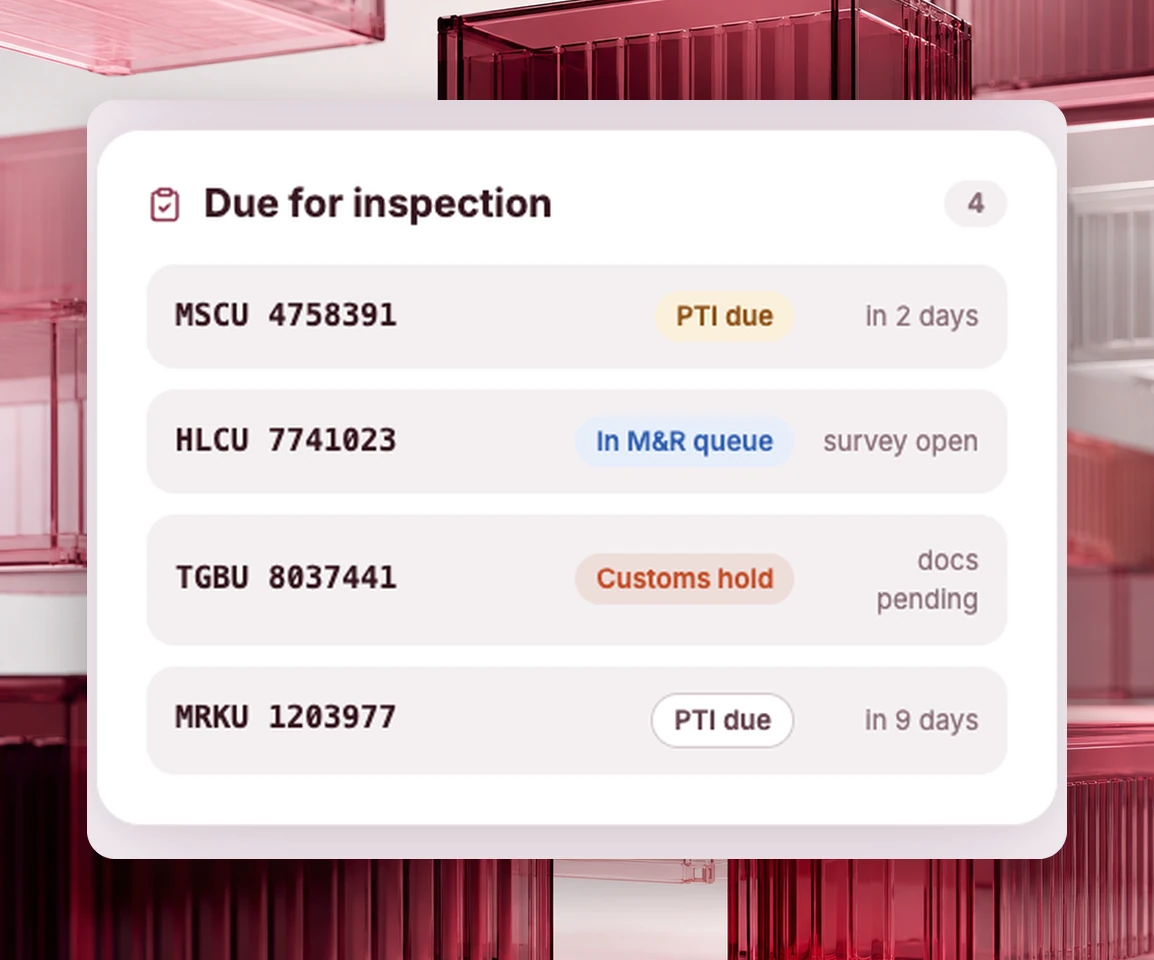
Surface containers due for inspection

Filter the 3D view by inspection status. Hold flags, M&R queues, and PTI due dates show up on the map, no extra tab required.
Learn more
M&R queue overlay on the map
PTI countdown per container
Hold flags visible on the map
DENSITY

See density. Tune strategy for your terminal.

Drag a block to a proposed density and the map projects what each placement will cost in future moves. Configure custom optimization strategies per equipment depth, per RTG span, per rail-track proximity. A rail-side terminal optimizes differently from a depot, and you tune that without a consulting project.
Learn more
Density caps adjustable per block, with retrieval cost projection
Custom optimization per equipment depth and rail-track proximity
Tune the strategy without a consulting project
AUDIT

Replay any moment, any container

Scrub backward to any point. The timeline carries every gate event, every yard move, every lift, and every reefer reading.
Learn more
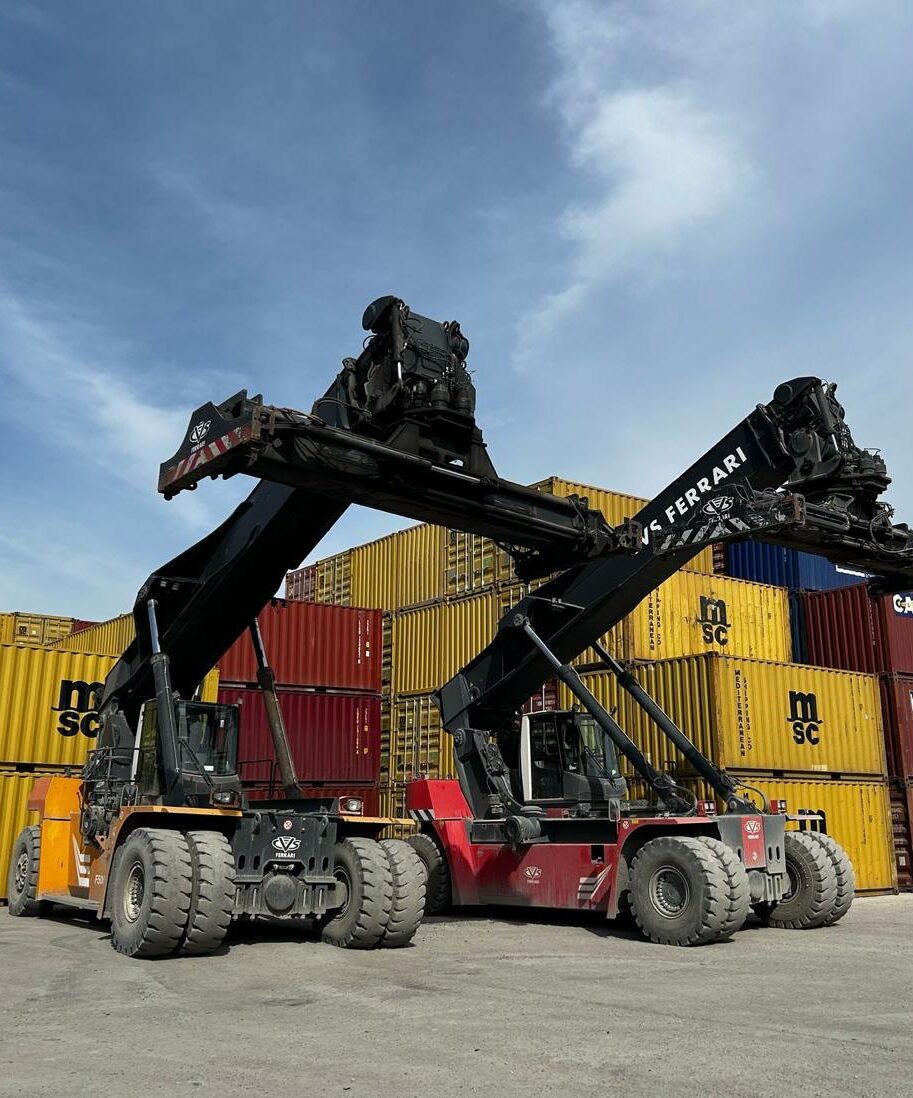
RTG, RMG, reach stackers, straddle carriers, top picks
Mobile or tablet, no special hardware
Same operator pool, modern tooling
Outcomes

What changes after Teux

Dispatchers stop walking the yard
The map shows what the phone call used to.
Operators stop guessing
The next move is on the app, not in somebody's head.
Audits stop being painful
Replay any container, any move, any day.
Lift counts stop being guessed
Every move is logged automatically for billing
“Our dispatchers had paper, radios, and a whiteboard. The whiteboard was always wrong.”  

Supervisor, container depot, EMEA region
Book a demo
Proof

Four dispatchers became two

What changes when the dispatch board goes away
terminal 1terminal 2
We replaced spreadsheets and a WhatsApp group with the 3D yard map in the first month. Dispatcher count went from four to two for the same volume.
Operations Director
Container depot, EMEA region
Case study

Want the full story?

All Updates

See the 3D yard map running on your data

A 30-minute call. We load yesterday's yard activity into a sandbox and show you the 3D map of your terminal with your actual containers.
Book a demo